Anticipated Features for MidjourneyV7: Exploring Possibilities
203
2024 / 02 / 28
Recommend an arcticle:Extracting the location of flooding events in urban systems and 7 analyzing the semantic risk using
Author: ZhangYan
The aggregation of the same type of socio-economic activities in urban space generates urban functional zones, each of which has one function as the main (e.g., residential, educational or commercial, and is an important part of the city. With the development of deep learning technology in the fifield of remote sensing, the accuracy of land use decoding has been greatly improved.
However, no fifiner remote sensing image could directly obtain economic and social information and it has a high revisit cycle (low temporal resolution), while urban flflooding often lasts only a few hours. Cities contain a large amount of "social sensing" data that records human socio-economic activities, and GIS is a natural discipline with strong socio-economic ties. We propose a new GeoSemantic2vec algorithm for urban function recognition based on the latest advances in natural language processing technology (BERT model), which utilizes the rich semantic information in urban POI data to portray urban functions. Taking the Wuhan flflooding event in summer 2020 as an example, we identifified 84.55% of the flflooding locations in social media.
We also use the new algorithm proposed in this paper to divide the main urban area of Wuhan into 8 types of urban functional zones (kappa coeffiffifficient is 0.615) and construct a "City Portrait" of flflooding locations. This paper summarizes the progress of existing research on urban function identifification using natural language processing techniques and proposes a better algorithm, which is of great value for urban flflood location detection and risk assessment.

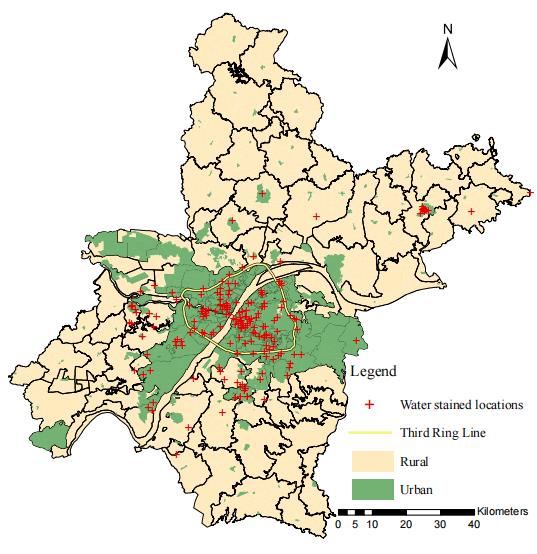
Waterlogging locations in Wuhan City in summer 2020 (190 waterlogging locations, 2,989 related Weibos)

Risk of waterlogging in Wuhan (Figure A: Road Scale, Figure B: Neighborhood Scale)

Calculated city function classification results
